
Understanding and Controlling Cloud Costs with AWS Cost Anomaly Detection
As organizations grow, so does their reliance on the cloud. What starts as a controlled, predictable environment can quickly evolve into a complex ecosystem of services, regions, and workloads.
To meet increasing demand, teams scale up compute resources, spin up new services to reduce latency, and expand across regions to support users globally. While this agility is one of the greatest strengths of cloud platforms like AWS, it also introduces a critical challenge: cost visibility.
The Hidden Cost Problem in Cloud Growth
In fast-moving environments, infrastructure decisions are often made with performance and availability in mind, not cost. Engineers may provision additional Amazon EC2 instances during traffic spikes, enable new storage layers in Amazon S3, or deploy services across multiple regions to improve user experience.
Individually, these decisions make sense. However, they can lead to unexpected and sometimes significant cost increases.
But the real issue is not just higher spending, rather it is the lack of clarity behind it.
When viewing the monthly bill, one may ask:
· Why did the costs spike this week?
· Which service or account is driving the increase?
· Is this expected growth or an anomaly?
· Who made the change and is it still needed?
Without a centralized and intelligent view, teams may often spend hours manually analysing billing data, correlating usage patterns and trying to pinpoint the root cause.
A Smarter Approach: Cost Visibility with AWS
This is where the AWS Cost Anomaly Detection & Control Dashboard becomes a game changer.
By combining machine learning, driven anomaly detection with rich billing visualizations, the dashboard provides a single pane of glass for understanding cloud spend. Instead of reacting to billing surprises at the end of the month, teams can proactively monitor and investigate cost behaviour in near real time.
At its core, the solution integrates AWS Cost Anomaly Detection with analytics tools such as Amazon QuickSight, enabling users to visualize spending patterns alongside technical usage metrics.
Key Capabilities
1. Intelligent Anomaly Detection
AWS uses machine learning to establish a baseline of normal spending behaviour based on historical data. It then continuously monitors for deviations such as sudden spikes in EC2 usage or unexpected data transfer costs.
These anomalies are not just flagged but contextualized as well, helping teams distinguish between expected growth and unusual activity. Custom thresholds can also be configured to align with business sensitivity and risk tolerance.
2. Deep Cost and Usage Visualizations
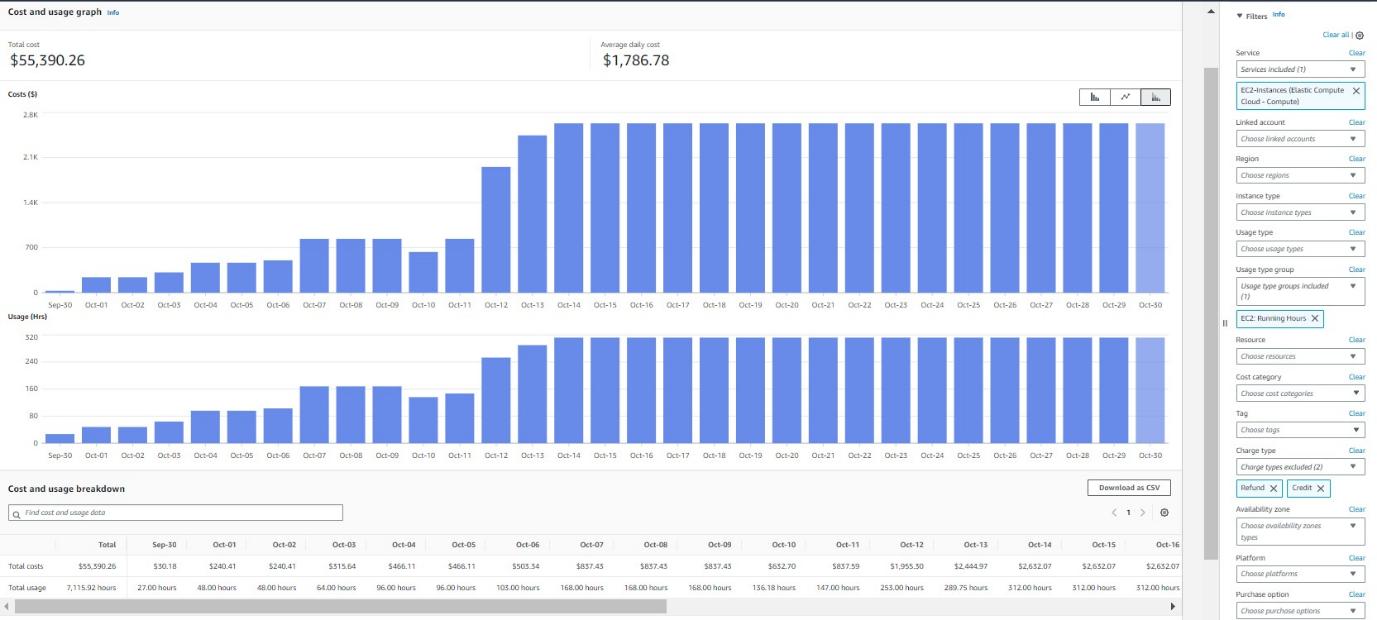
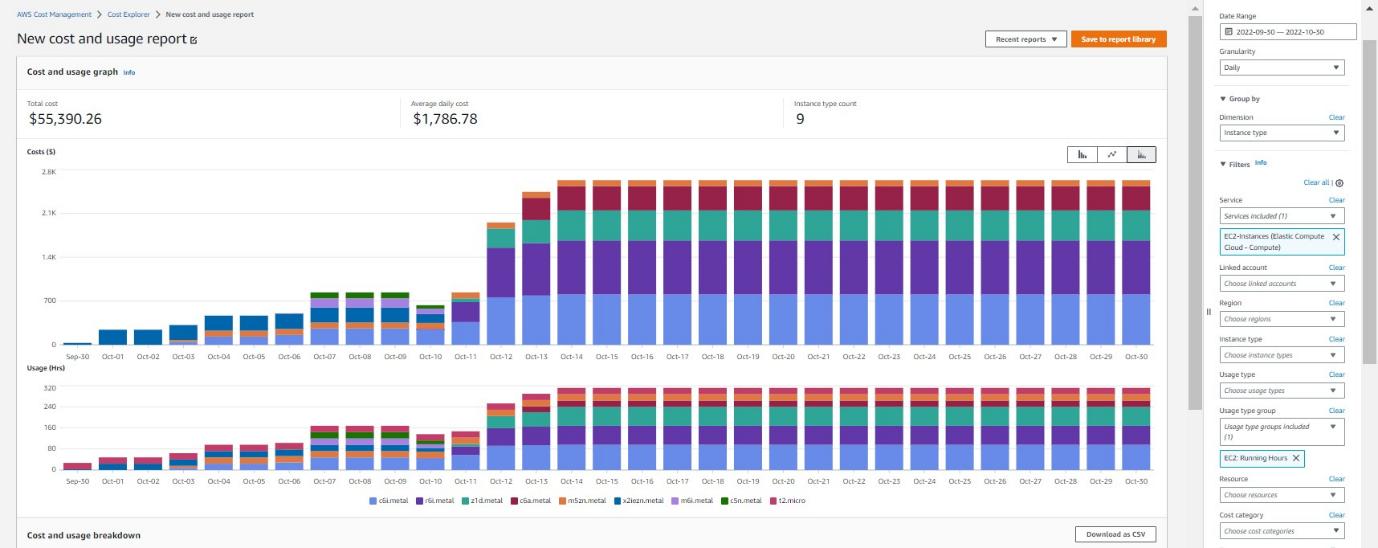
The dashboard transforms raw billing data into actionable insights through intuitive charts and breakdowns, including:
· Monthly costs by service, account, or region
· Usage trends over time (e.g., six-month analysis)
· Service-level contribution to cost spikes
· Metrics such as Savings Plans coverage and EC2 running hours
These visualizations allow users to quickly correlate technical activity with financial impact, making it easier to understand not just what changed, but why.
3. Proactive Alerts and Notifications
Instead of discovering issues after costs have already accumulated, users receive timely alerts when anomalies are detected. Notifications can be configured via email, Amazon SNS, or integrated workflows, enabling rapid response to potential overspending.
How It Works in Practice
The dashboard is accessed through the AWS Billing and Cost Management console, where it combines data from Cost Explorer with anomaly detection insights.
For example, if there is a sudden 50% increase in data transfer costs, the system will:
1. Detect the deviation from historical patterns
2. Flag it as an anomaly
3. Break down the contributing factors
4. Visualize the spike through charts and trend lines
This allows teams to immediately identify the root cause such as a newly deployed service or misconfigured resource and take corrective action.
Driving FinOps Maturity
For FinOps teams and cloud stakeholders, this solution acts as a centralized decision-making layer.
Instead of fragmented tools and manual analysis, organizations gain:
· A unified view across multiple AWS accounts
· Faster root cause analysis (minutes instead of hours)
· Improved accountability and transparency
· Data-driven cost optimization decisions
Conclusion
In today’s cloud-first world, scaling infrastructure is easy, but controlling costs is a whole other challenge.
The AWS Cost Anomaly Detection & Control Dashboard bridges this gap by providing both visibility and intelligence. It empowers teams to move from reactive cost management to proactive optimization, ensuring that cloud growth remains sustainable, predictable, and aligned with business goals.